Abstract: In March 2026, JAMA released the fourth edition (Ver.4.0) of the SAKURA Automated Driving Safety Evaluation Framework — a 344-page national-level safety evaluation technical document. This article systematically examines this safety evaluation system jointly developed by Toyota, Honda, Nissan, and other major Japanese automakers, covering its corporate value, engineering perspectives, core methodology, and the frontier challenges posed by the end-to-end AI era, while exploring its implications for China’s standardization efforts.

Figure 1
In March 2026, the SAKURA project officially concluded, and the Japan Automobile Manufacturers Association (JAMA) released the fourth edition of the SAKURA Automated Driving Safety Evaluation Framework — a 344-page technical document.
This is not an internal report from a single automaker. It is a national-level safety evaluation system jointly developed by Toyota, Honda, Nissan, Mazda, Subaru, Suzuki, Hino, Mitsubishi, and virtually all major Japanese OEMs, together with Tier 1 suppliers including Bosch Japan and Continental Japan, under the leadership of Japan’s Ministry of Economy, Trade and Industry (METI).
The SAKURA project chair, Satoshi Taniguchi from Toyota, also serves as the project leader for ISO 34502. The project has maintained close collaboration with the well-known German PEGASUS series of projects and supported the first L3 regulation, UNECE R157. In other words, the methodology in this document has directly shaped international standards.
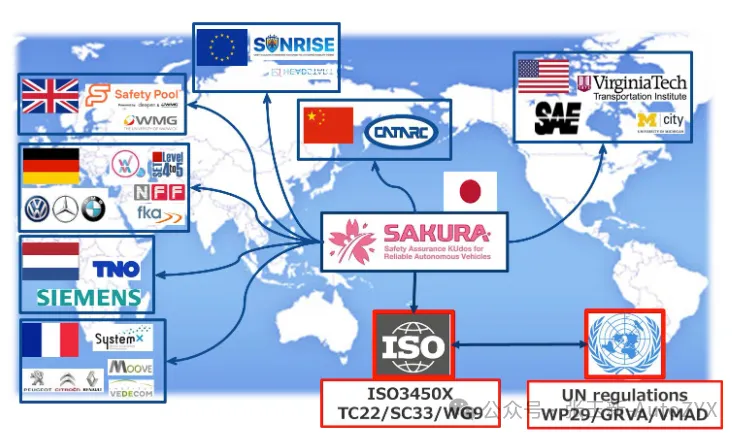
Figure 2
Why is it worth our time? And where can we apply what we learn from it?
This article provides a systematic analysis — from corporate value and engineering value, through core methodology, all the way to the frontier challenges of the end-to-end AI era.
1. First Things First: What Exactly Does SAKURA Do?
SAKURA stands for Safety Assurance for automated driving using Knowledge-based Universal Risk Assessment. The full name is long, but the core idea is concise:
Use physical principles to systematically enumerate all safety scenarios that automated driving must address.
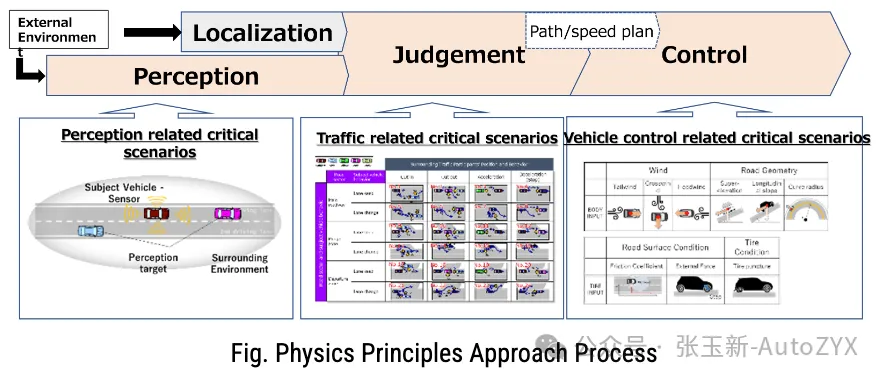
Figure 3
How does it work in practice? The framework decomposes the Dynamic Driving Task (DDT) into three processes — Perception, Decision-making, and Control — then identifies potential disturbance factors for each process based on physical principles:
Perception disturbances are determined by sensor physics — under what conditions will radar (electromagnetic wave characteristics), LiDAR (infrared light characteristics), and cameras (visible light characteristics) each “fail to see clearly”?
Traffic disturbances are systematic combinations of road geometry x ego vehicle behavior x surrounding vehicle behavior — what traffic situations constitute threats?
Vehicle dynamics disturbances are physical forces acting on the vehicle — how do road surface conditions, wind forces, and tire performance affect vehicle control?
The essence of this approach lies in: Rather than reverse-engineering scenarios from accident data (data-driven), it derives scenarios forward from physical first principles (principle-driven). The advantage is the ability to argue for completeness of the scenario set — you can articulate why these scenarios are “sufficient.”
Building on this, the framework establishes a four-quadrant model: all scenarios are classified along two dimensions — “reasonable foreseeability” and “preventability.” The core evaluation target is Quadrant A — scenarios that are both foreseeable and preventable, where the automated driving system must not cause accidents.
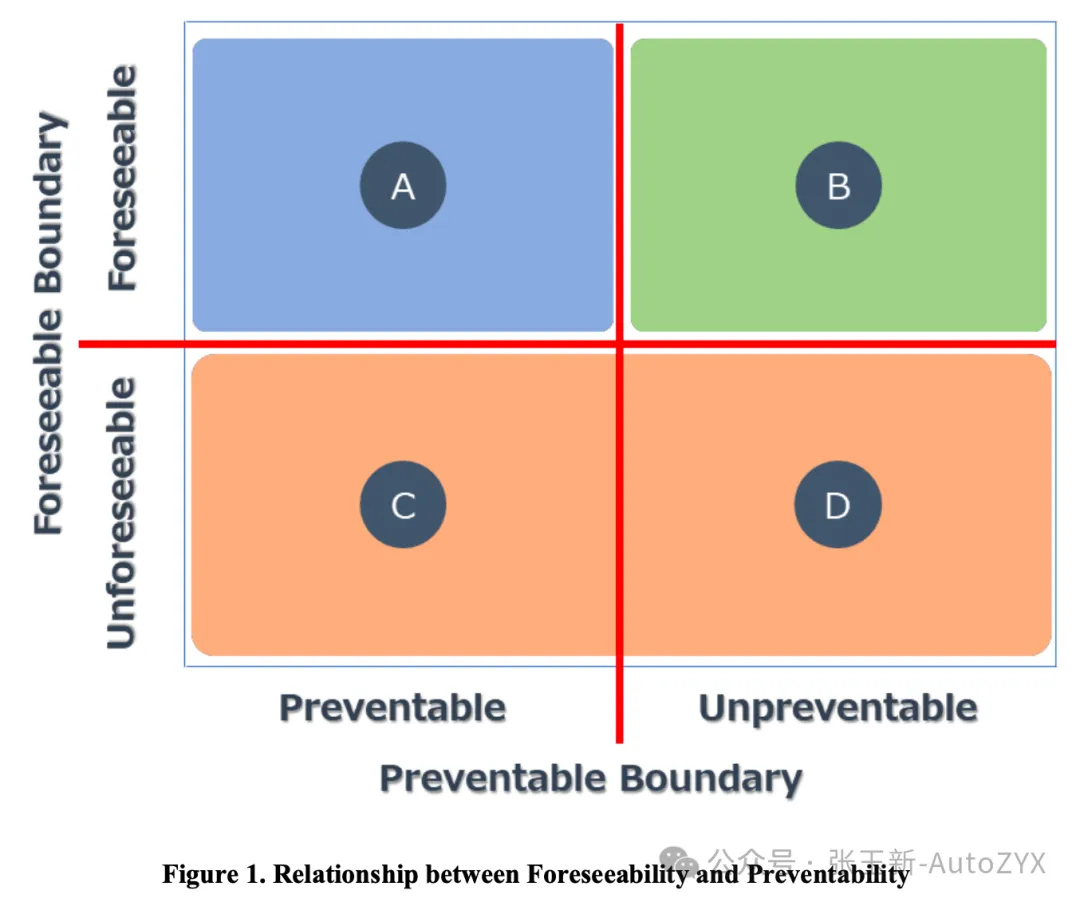
Figure 4
Compared to previous versions, the most significant update in Ver.4.0 is the comprehensive inclusion of urban driving scenarios and Vulnerable Road Users (VRUs, i.e., pedestrians and cyclists), building on the earlier focus primarily on structured roads, along with expanded occlusion scenario considerations for general roads.
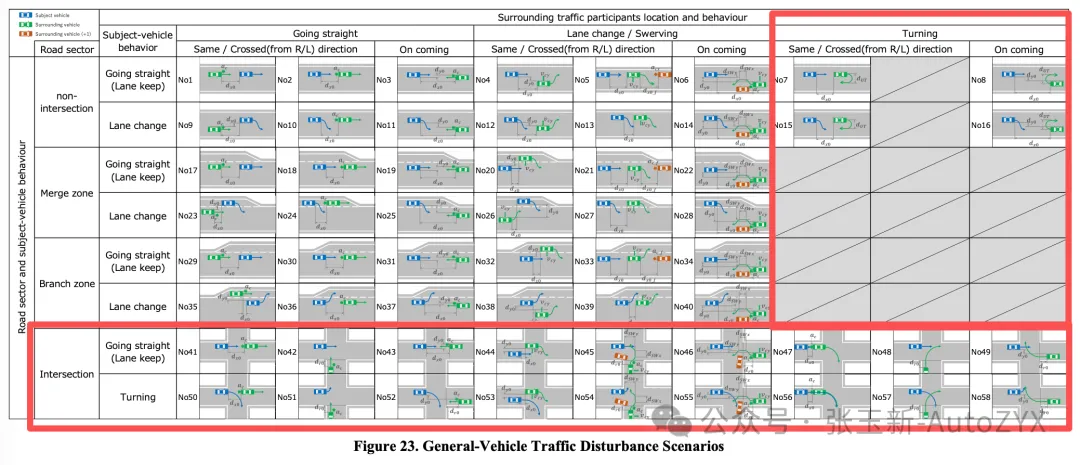
Figure 5
2. Who Benefits from This Document?
OEMs
Safety argumentation structure. The document presents a complete safety assurance process aligned with ISO 21448 — a closed loop from ODD definition to safety evaluation. OEM safety departments can directly reference it to build their own safety argumentation frameworks.
Scenario matrix. Through systematic combination, the framework constructs 58 categories of traffic disturbance scenarios, providing a structured starting point for test scenario library development. No more starting from scratch based on guesswork.
C&C Driver model. This is one of the most technically rich sections of the document — it quantifies human driver collision avoidance behavior into specific parameters: perception delay of 0.75 seconds, maximum deceleration of 0.774G. These numbers directly define the baseline for safety criteria.
AD Technology Companies
Core reference for overseas compliance. Annex G directly corresponds to the simulation verification requirements of UN R-157. If your AD system is destined for international markets, this chapter is essential reading.
Quantitative basis for Pass/Fail. The document provides preventability boundaries for three typical scenario types — Cut-in, Cut-out, and Deceleration — where the green zone indicates conditions under which the system should be able to avoid collisions. This is a direct source for algorithm test criteria.
Sensor Suppliers
Annex E spans approximately 100 pages and is one of the most systematic sensor physics-based disturbance scenario modeling documents in the world. It covers 5 categories of millimeter-wave radar disturbances, 3 categories of LiDAR disturbances, and 3 categories of camera disturbances, each with a complete disturbance model built from physical first principles. Required reading for sensor teams.
Research Institutions
The Physical Principle Approach itself represents methodological innovation. The limitations of the C&C Driver model (covering only braking, only the safety dimension, and region-limited parameters) are explicit open research questions. Quantitative methods for VRU scenarios are still under development.
3. How Engineers Should Read It
Different engineering roles have vastly different focus areas.
Algorithm Engineers
The key takeaway is understanding that scenarios are not randomly generated but systematically derived through DDT process decomposition and physical principle reasoning. Focus on Chapter 5 — how Cut-in scenarios progress from data collection to parameter extraction, distribution estimation, and probability threshold setting, step by step defining the “reasonably foreseeable” parameter range. Also examine Section 6.4 on preventability boundaries — this directly determines how much safety margin your planning module should incorporate.
Functional Safety / SOTIF Engineers
Focus on the safety assurance workflow diagram in Section 3.1 — it clearly shows how SAKURA maps ISO 21448’s four quadrants to WP29’s four quadrants. The C&C Driver model essentially answers a core SOTIF question: What level must the system achieve to demonstrate that an accident was “preventable”? The coverage verification method in Annex D (cross-validated against three major accident databases — GIDAS, NHTSA, and ITARDA, achieving approximately 90% coverage) directly supports the argument for “sufficient identification of triggering conditions.”
Test Engineers
Start with the three-layer scenario abstraction hierarchy in Chapter 4 (Functional Scenarios, Logical Scenarios, Concrete Scenarios) to understand test case design granularity, then proceed to the parameterization methods in Chapter 5 and the simulation verification standards in Annex G.
Sensor Engineers
Go directly to Annexes E and F — the systematic failure mode identification method based on physical first principles is far superior to traditional experience-based enumeration.
4. Implications for China’s Standardization Efforts
Having covered SAKURA itself, the more important question is: What does it mean for us?
The gap in scenario completeness argumentation. China’s current standards predominantly use typical scenario enumeration, lacking the kind of systematic derivation from physical principles that SAKURA provides. This is not merely a methodological difference — it is a difference in the persuasiveness of safety argumentation. Can you clearly explain “why these test scenarios are sufficient”?
The urgent need for localized driver models. SAKURA’s C&C Driver parameters are based on Japanese driver data. Existing research has shown that Chinese drivers exhibit significant differences from European and Japanese drivers in cut-in scenarios and car-following behavior — directly reusing these parameters is not appropriate.
The uniqueness of VRU scenarios. The degree of mixed traffic between vehicles, pedestrians, and cyclists on Chinese urban roads far exceeds that of Japan and Europe. Parameterization and safety criteria for pedestrian and cyclist scenarios must be established using Chinese local data.
5. The Evolution of C&C Driver: Toward a Driver Foundation Model
The C&C Driver is a good model — clear in concept, explicit in parameters, and highly actionable. But it has three fundamental limitations: it only considers braking for collision avoidance, it only evaluates the safety dimension, and its parameter sources are regionally constrained.
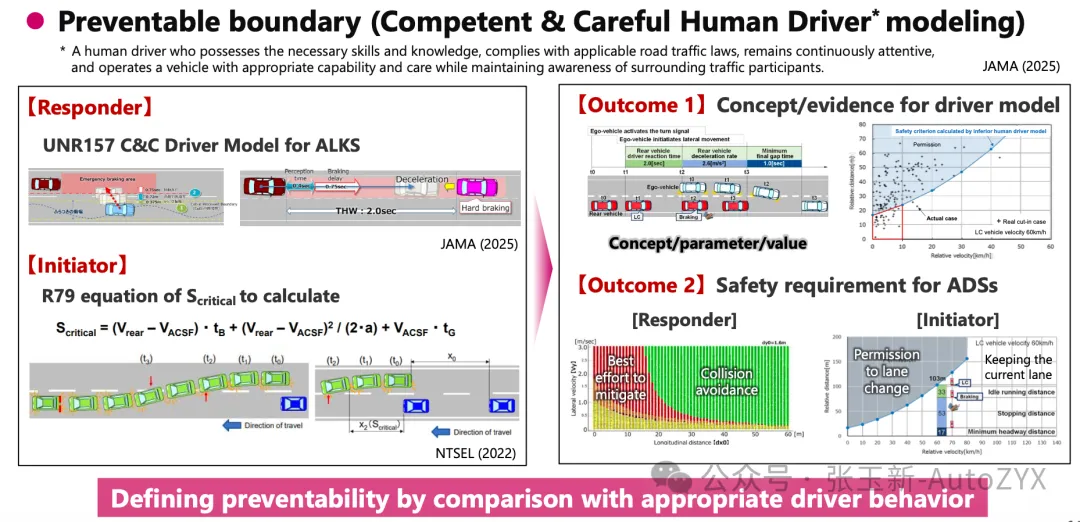
Figure 6
The concept of a Driver Foundation Model (DFM) offers a breakthrough path.
The core idea of DFM is: rather than relying on rigid safety boundaries derived from theoretical models, it “distills” flexible behavioral benchmarks from large-scale real driving data, encompassing multiple dimensions including safety, efficiency, and comfort.
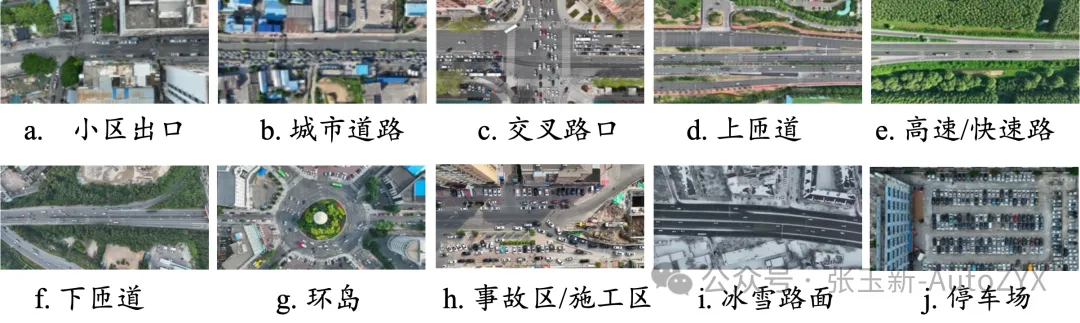
Figure 7
DFM details: “How Should an Autonomous Vehicle Actually Drive?” — The Driver Foundation Model Provides the Answer
DFM is fundamentally different from models like DriveGPT and GAIA-1. The latter follow a “behavior generation paradigm” — learning to drive. DFM follows a “behavior evaluation paradigm” — learning to evaluate. DFM does not generate trajectories; it outputs “capability envelopes” — multi-dimensional conditional probability distributions that tell you “what the behavior distribution of competent drivers looks like in this scenario.”
DFM has natural integration points with SAKURA:
SAKURA’s scenario parameters (e.g., 6 parameters for Cut-in scenarios) serve directly as input condition variables for DFM.
DFM’s capability envelopes can extend C&C Driver’s binary Pass/Fail to continuous distribution-based evaluation.
DFM defines the “competent driver” benchmark from large-scale data through percentile selection mechanisms, offering greater statistical representativeness than small-scale experimental data.
The implication for us: Training DFM using large-scale Chinese driving data to establish quantitative benchmarks for “competent and careful drivers” that reflect Chinese traffic characteristics is not merely an academic question — it is the data foundation for implementing UN R-157 in a Chinese context.
6. The End-to-End Era: Fundamental Challenges to Scenario-Based Testing
The final topic, and the deepest one: When end-to-end automated driving becomes mainstream, will scenario-based testing frameworks like SAKURA still work?
Five fundamental challenges:
Intermediate states become unobservable. SAKURA’s three categories of disturbances implicitly assume a modular architecture — perception, decision-making, and control can be evaluated separately. E2E fuses these three processes into one. “Whether the system correctly perceived the target” is no longer observable.
The causal chain breaks. In a modular architecture, a collision can be attributed to “perception miss” or “planning error.” In E2E systems, behavior is emergent, making attribution extremely difficult.
Behavioral non-determinism. E2E-based automated driving may produce different outputs for the same scenario input. Traditional frameworks assume deterministic system behavior.
Combinatorial explosion of long-tail scenarios. E2E models may produce dramatically different outputs in response to small input variations (butterfly effect), causing the difficulty of parameter space coverage to grow exponentially.
Coverage Illusion. This is the most profound challenge — scenario enumeration is essentially sampling discrete points in a continuous state space, while safety violations tend to occur near structural boundaries. “Having generated enough scenarios” does not equate to “the system is sufficiently safe.” Even AI-driven scenario generators tend to reinforce the statistical center of training data, while safety violations exist precisely in the low-probability tails of the distribution.
Scenario quantity cannot substitute for structured safety assurance. So what do we do?
I believe that future automated driving safety evaluation requires three layers working in concert:
Layer 1: Formal specifications. Formal verification and reachability analysis answer the question: “Regardless of the scenario, what must never happen?” This does not rely on scenario enumeration but provides coverage information at the structural level — which regions of the state space are provably safe? Which remain unknown?
Layer 2: Structured scenario testing. This is what SAKURA does — building a finite and complete scenario taxonomy based on physical principles, providing an actionable testing approach.
Layer 3: AI-driven scenario generation. Leveraging world models and generative models for efficient exploration and boundary stress testing in the parameter space.
Each layer has its strengths and limitations. The key is establishing a synergistic mechanism: Formal methods define safety boundaries. SAKURA-style methods translate boundaries into actionable test scenarios. AI-driven generation methods efficiently explore within those scenario spaces.
Under this framework, scenarios are no longer independent “evidence” of safety but rather “witnesses” — passing scenarios witness consistency with safety properties, while failing scenarios witness the existence of counterexamples. Each scenario is traceable to a formal property, a state space region, or a set of assumptions. This traceability is what regulators increasingly demand.
7. Conclusion
JAMA SAKURA Ver.4.0 is one of the most systematic scenario-based automated driving safety evaluation methodology documents available globally. Its value lies not only in the 344 pages of technical detail, but in demonstrating a methodological paradigm for systematically constructing safety evaluation systems from physical first principles.
For China’s automated driving industry, the core recommendation is:
Use the SAKURA framework as a methodological foundation, integrate data-driven DFM concepts, introduce the structural assurance of formal methods, and build a multi-dimensional, probabilistic, and localized safety evaluation system adapted to the end-to-end era.
This is not an easy undertaking, but it is a necessary one.
References and Links
Three Core References
[1] Automated Driving Safety Evaluation Framework Ver. 4.0 -Guidelines for Safety Evaluation of Automated Driving Technology
JAMA website: https://www.jama.or.jp/english/reports/framework.html
SAKURA project website: https://www.sakura-prj.go.jp/project_info/
[2] Zhang Y, Wang C, Shum H P H. Benchmarking Autonomous Vehicles: A Driver Foundation Model Framework. CARS@EDCC, 2026.
arXiv full text: https://arxiv.org/html/2602.08298v1
[3] Zhang Z. Beyond Scenarios: Why AI-Driven Scenario Testing Is Incomplete Without Formal Methods (2026)
Zengjie Zhang blog: https://zhang-zengjie.github.io/blogs.html?blogId=20260220
Other References Cited in the Article
End-to-End Autonomous Driving Survey
Chen L et al. End-to-End Autonomous Driving: Challenges and Frontiers. IEEE TPAMI, 2024.
DriveGPT — Large-Scale Autoregressive Driving Behavior Model
Huang X et al. DriveGPT: Scaling Autoregressive Behavior Models for Driving. ICML, 2025.
DiffusionDrive — Diffusion Model-Driven End-to-End Autonomous Driving
Liao B et al. DiffusionDrive: Truncated Diffusion Model for End-to-End Autonomous Driving. CVPR 2025.
GAIA-1 — Generative World Model
Hu A et al. GAIA-1: A Generative World Model for Autonomous Driving. arXiv:2309.17080, 2023.
C&C Driver Model Empirical Validation
Olleja P et al. Validation of Human Benchmark Models for Automated Driving System Approval: How Competent and Careful Are They Really? Accident Analysis & Prevention, 2025.
Chinese Driver Behavior vs. ECE R157 Comparison
Liu R et al. Comparison Between Cut-In Performance Model of ECE R157 and Behaviors of Chinese Drivers. Automotive Innovation, 2025.Springer
China-Germany Car-Following Behavior Comparison
Li Z et al. Development of Human-Like Automated Driving Following Rules: A Comparison between China and Germany. Transportation Planning and Technology, 2025.Taylor & Francis